2023 round-up

A message from our Research Co-Directors

This year the Personal Finance Research Centre published 12 new research reports and 5 policy briefings. At the same time, our team have found time to respond to consultations and calls for evidence, write peer-reviewed journal articles, speak at conferences and on radio shows, and lead some of the projects that we’ll be reporting on in 2024.

All of this activity has the common goal of sharing our research as widely as possible and promoting our recommendations for changes to policy and practice that can improve situations for individuals and households.

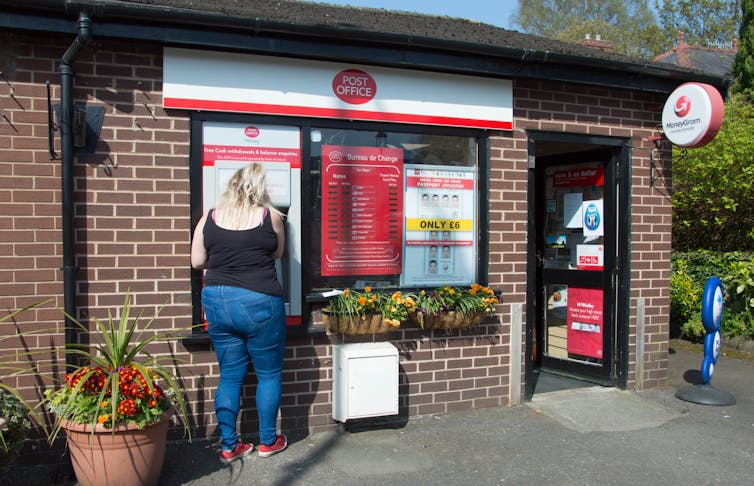
In 2023, the cost-of-living crisis remained at the top of the policy agenda, and we spent the year researching its impact. Our Financial Fairness Tracker (in partnership with abrdn Financial Fairness Trust) has documented how UK households are coping. The 8th and 9th waves of the Tracker in May and October found ‘a new normal’ where some households are beginning to adjust to higher costs, but their overall financial wellbeing remains significantly worse than in 2020 and 2021. We also investigated the financial wellbeing of disabled people; considered the role that housing tenure plays in household finances; and collected first-hand testimonies from people who struggled with high energy costs last winter. In all our reports, we highlight the real-world implications of our findings and make evidence-based recommendations about how best to support those who need it.

As ever, collaboration has been a fundamental part of our research in 2023 – with other academics and research organisations, policymakers and practitioners, charities and civil society organisations, and – crucially – the lived experience experts and research participants whose views and experiences we seek to accurately represent through our work. Our thanks to everyone we’ve worked with this year.

If you haven’t already done so, we hope you find the time to engage with at least some of our research. And please do get in touch if you have any questions or reflections to share.

Wishing you all the best for the new year.

Sharon Collard and Sara Davies, Research Co-Directors


Research and policy

In 2023 we explored:

All of these outputs are available on our website.


🎉PFRC at 25🎉: UK Household Finance and Poverty Conference

Photo collage of peakers and delegates at the UK Household Finance and Poverty Conference in November 2023.
Speakers and delegates at the UK Household Finance and Poverty Conference in November 2023.

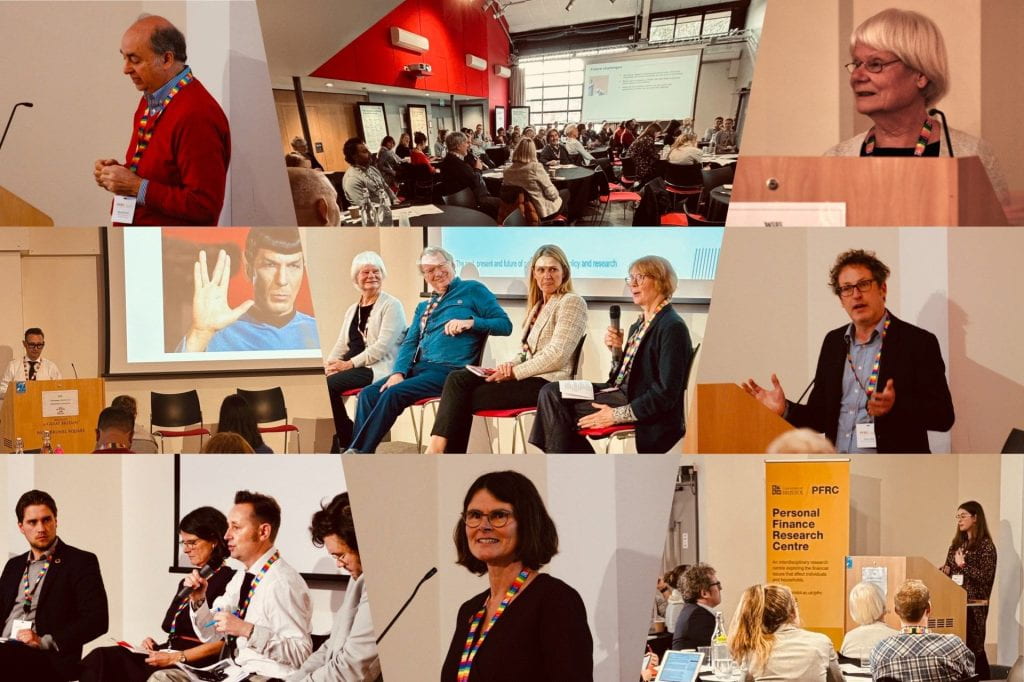
In November we hosted a one-day in-person conference to celebrate 25 years of PFRC, which was founded in 1998 by Professor Elaine Kempson. The conference agenda centred around three themes:

  • Reflections on the past, present and future of household finances through the lens of 25 years of impactful research.
  • The seen and unseen dimensions of poverty, with a focus on housing and energy.
  • Research into policy and practice.

Attended by over 80 delegates, it was a day of excellent keynote speeches, lively panel discussions and stimulating conversations. It was also a fantastic opportunity to catch up with old friends and colleagues and make new connections. Our thanks to everyone who joined us and helped make it such a great day.


Want to keep up-to-date with our latest research? Join our mailing list

The price of poverty: why being poor still costs more

By David Collings and Sara Davies

Over 14 million people in the UK population live in poverty, and many more live on low incomes. Unfair poverty premiums – the additional costs people on low incomes incur when paying for essential goods and services – put undue strain on the household budgets that can least afford it, locking people into cycles of poverty. Since we published our 2016 research, the nature of the poverty premium may have changed but it certainly hasn’t gone away. And according to our latest research for Fair By Design and Turn2Us, a national charity providing practical help to people struggling financially, people already struggling financially are paying almost £500 more for essentials like energy, credit and insurance.

The average premium is almost £500, and reflects the current market and regulatory landscape

In 2019, Fair By Design and Turn2US asked us to explore recent changes to the poverty premium landscape – including both regulatory and technological changes – to understand if they are having an impact on the cost of poverty premiums or the number of people paying them. To do this we surveyed 1,000 people living in low-income households who had contacted Turn2Us for help. Our research showed that low-income households incur an average £478 of extra costs through energy, insurance, and credit poverty premiums:

  • Car insurance was the biggest contributor to the premium in 2019 at nearly £500 – some pay nearly £300 more per year because they live in a deprived area, and additional charges for paying monthly instead of annually could add a further £160. This premium is markedly higher than it was in 2016, when together these cost an extra £155.
  • Credit is particularly expensive on a low income, in whatever form it takes. For example, a sub-prime credit card costs around £200 more per year on average, and personal loans cost more than £500 extra.
  • And we found similar inequalities in relation to energy; the best prepayment tariff could still be around £130 more expensive than the best online-only deal, and paying on receipt of bill could cost an additional £143 more per year. However, the drop in the premiums incurred via energy costs since 2016 suggests that the tariff caps implemented by Ofgem have had a positive effect.

Of course, while £478 is the average premium, there is no such thing as an average low-income household. The extent and experience of the poverty premium varies widely between groups and families.

Unfair poverty premiums are yet another example of the inequality of poverty

Our research was undertaken in late 2019, before the onset of the pandemic. However, recent evidence shows that the economic and social consequences of Covid-19 are being felt most keenly by those on low incomes, with lower-paid workers more likely to have been furloughed or to have lost their jobs. Coping with tough times is hard enough when approached from a generally constrained financial position, but the finances of low-income households had already been worsening in the years leading up to 2020 – real income growth stalled in 2017-18, something that affected the poorest the most. And the social safety net had been badly damaged, with cuts to working-age benefits and tax credits further pushing down the incomes of low-income households. Seen in this context, poverty premiums are yet another example of the inequality of poverty, compounding and extending hardship at a time when increasing numbers are experiencing major falls in income, perhaps tipping people over from just about managing to not managing.

What happens next?

We can be certain that the pandemic’s economic impacts are with us for the foreseeable future. But while much in 2020 remains outside of our control, the poverty premium was and remains a solvable problem. Regulators and policymakers should now work together to find solutions for people struggling across all markets. In recent years we’ve already seen the positive impact of such interventions, most notably in the form of price caps. So what more can we do now?

We’ll leave the last word to Jamie Greer of Turn2Us:

“Stronger regulation of financial products, an improved social security net with crisis grants and protective changes to the energy market would mean we can start eradicating the poverty premium.”


Read the report and executive summary

Identifying vulnerable communities at risk of being left behind in a cash-lite society

By Daniel Tischer, Sara Davies & Jamie Evans

These days it’s common to hear discussion of the UK being on the verge of becoming a ‘cashless’ society – but, for a range of reasons, this may be premature. For the foreseeable future, a more appropriate term may be ‘cash-lite’. In this blog, Dr Daniel Tischer reflects on our research in South Wales in which we explore a new method for identifying and protecting the most vulnerable communities in a ‘cash-lite’ society.

Much recent commentary suggests that the UK, and a number of other countries, are rapidly moving towards becoming ‘cashless’ societies – but there remain multiple hurdles standing in the way of ‘cashlessness’. One such hurdle is that digital payments do not yet quite match cash for reliability: technical ‘glitches’ too often stop us from paying digitally. The (partial) outage of the VISA network in June 2018, for example, left many Europeans unable to pay by card, and other, smaller-scale incidents are not infrequent either. There are also big hurdles related to consumer needs and preferences, or the unsuitability of digital in certain circumstances (for example, in areas with no / a poor internet connection).

This leads to the conclusion that, in the near future at least, the UK will not become cashless. Rather it seems we are becoming a ‘cash-lite’ society – one in which cash usage is forecasted to decrease to about 1 in 10 transactions by 2028 – mirroring the experience of other low-cash countries, such as Sweden and Canada.

Vulnerability & the poverty premium in a cash-lite society

So what does a cash-lite society mean for consumers? Well for most people, most of the time, there will be few problems – but that does not mean that there are not significant risks that need to be mitigated. As fewer transactions are made in cash, more ATMs will be closed down or switched from free to fee-charging – and, as we saw both in our case study of Bristol’s cash network published in May last year and in national research from Which? in September, the latter of these is an issue which disproportionately affects more deprived areas.

Paying to access cash was a component of the University of Bristol’s ‘poverty premium’ calculations in 2016, albeit a relatively small one, and this suggests that vulnerable communities may be left even further behind. Even a small charge of £1 per transaction present a significant cost to low-income households, especially when only small sums—£10 or £20—are taken out to purchase basic food items or pay bills.

Identifying and supporting potentially vulnerable communities

As our society becomes more cash-lite, there is a danger of increasingly uneven access to cash across the country. This makes it important that we are able to map and identify those areas that are not only losing their ability to access cash but are also less resilient to such changes taking place.

Our second report on access to cash, published in January 2020, therefore advances our methodology from our Bristol case study to identify communities in South Wales that are most ‘vulnerable’ in terms of access to cash. We identify vulnerability in two steps: 1) by considering their current ability to access cash – where AvCash Index scores under 5 highlight communities with a low number of ATMs or other cash infrastructure within a 1km radius; and 2) by taking into account communities’ ability to cope without such access. The latter involves the construction of a measure of travel difficulty, indicating that a high proportion of residents in an area may find it difficult to travel far to access cash (or other essential services, for that matter). This measure incorporates: levels of car ownership, disability, age, income and access to public transport (in the form of nearby bus stops).

Looking at communities with poor access to cash and a high proportion of residents who may struggle to travel to access their money, provides us with a clearer idea of where poor cash infrastructures may have the highest negative impact. While this of course does not mean that there will not be individuals in other areas for whom access to cash is a problem, it does offer a useful tool for the industry to prioritise need – for example, when evaluating communities’ requests for a new ATM or identifying which ATMs to protect through additional subsidies. Indeed, as shown in the map below, there are many vulnerable areas without protected ATMs which may benefit from them:

Map of vulnerable areas & protected ATMs

Overall, we find that over a quarter (27 per cent) of neighbourhoods in our case study fall within the 20 per cent worst areas nationally for travel difficulty and have an AvCash Index score of less than 10. Similarly, 8 per cent of areas score poorly for travel difficulty and have no free ATM, while a further 12 per cent of areas have just one free ATM and high travel difficulty. These neighbourhoods are not solely rural; many are located on the outskirts of towns. Taken together, we find that over 100,000 people in this region (out of approximately 500,000) live in vulnerable neighbourhoods and do not currently benefit from a protected ATM.

Our geographical mapping approach therefore presents a potentially valuable tool to identify vulnerability by taking a community-based perspective. It raises further questions about the sustainability of the UK cash infrastructure and the ability of LINK and regulators to reign in private and profit-driven actions by providers of access to cash.

But crucially, we believe that our approach provides policy-makers and regulators with additional insights into the impact current changes have on the most vulnerable communities, and to better understand what vulnerability means in particular contexts. We are hoping to work closely with stakeholders to map access to cash nationally to inform policies towards ensuring cash is available for free to those for rely on it.


Read the full report here:

Report: ‘Geographies of Access to Cash: Identifying vulnerable communities in a case study of South Wales.’

Does borrowing behaviour influence wellbeing?

by Sara Davies

Standard Life Foundation recently commissioned us to conduct a rapid evidence review to understand people’s borrowing behaviour and how it impacts their financial wellbeing. This involved a structured, critical analysis of around 150 relevant items and an assessment of their methodological strengths and weaknesses. We found:

  • Income strongly influences borrowing behaviour. Low-income households are less likely to use consumer credit than those on higher incomes, but more likely to use high-cost lenders when they do borrow, often to make ends meet.
  • Owning assets has some relation to borrowing behaviour. Homeowners have higher levels of borrowing than non-homeowners; their borrowing is linked to their level of housing assets. However, we lack evidence on the effects of savings on borrowing.
  • Psychological factors shape borrowing behaviour, but not as much as socio-demographics. There are complex interactions between different psychological factors; and one can mediate (and moderate or amplify) the effects of another. Psychological effects seem less powerful in explaining borrowing behaviour than other personal factors, such as income.
  • Macro-economic conditions play a major role in shaping people’s financial situations, their access to borrowing and the cost of borrowing. Aggregate consumer borrowing rises when macro-economic conditions are good and falls when they deteriorate. At firm level, credit card design and marketing (such as credit limit increases and zero-interest offers) encourage borrowing. Speed, convenience and easy access attract borrowers to use high-cost credit, particularly where they have few other credit choices.
  • Lower financial literacy is linked to poor borrowing behaviours and over-indebtedness. There are concerns young people, with lower financial capability overall, are particularly at risk from poor borrowing decisions. The evidence is weak regarding the impact of financial literacy programmes (which tend to focus on financial knowledge) upon financial behaviour

Read more about this research

Report | Key Findings

Older and poorer communities are left behind by the decline of cash

by Daniel Tischer, University of Bristol; Jamie Evans, University of Bristol, and Sara Davies, University of Bristol
An increasingly rare sight.
ShutterStockStudio / Shutterstock.com

A future without cash seems almost inevitable. Recent statistics paint a damning picture: while cash accounted for 62% of all payments by volume in 2006, this dropped to 40% in just a decade and is predicted to fall yet further to 21% by 2026.

Digital payments, on the other hand, are trending strongly in the opposite direction. Contactless payments in December 2018 in the UK were 28% higher than the same month in the previous year (at 691m in total), while the total number of card transactions increased by 12% over the same period.

In the long term, such a shift may well have benefits for many, given the speed and convenience that digital payments offer. But in the meantime, in the next five to ten years or so, there remain lots of people still dependent on cash – particularly those who are older or from lower income households. These people, it seems, are at risk of being forgotten if current trends continue. Ironically, those who are least likely to need cash have the best access to it.

Cash still king for many

We know there is still a sizeable proportion of the UK population that continues to depend on cash. An estimated 2.2m people report that they only use cash, while there are as many as 1.3m people who are “unbanked” (do not have a current account).

In our research, we regularly encounter people who find it difficult to access mainstream banking products, do not use digital payments because they find it easier to manage their money in cash, and/or simply lack trust in digital banking. For these people, cash very much continues to be king.

This means it’s important to understand the way in which access to cash is changing for the UK population. But much of the debate so far has focused on the overall number of ATMs or bank branches in the UK, without much understanding of the importance of geography. Where these dwindling number of ATMs are located makes a big difference.

Indeed, when this was studied in the early 2000s, we learnt that bank branch closures and fee-charging ATMs were more often found in poorer parts of the country. The issue was then seemingly remedied by measures such as the “Financial Inclusion Programme” put in place by LINK, the UK’s main ATM network. This programme incentivised ATM operators to provide cash machines in lower income neighbourhoods.

More and more people are relying on post offices for cash.
Michael J P / Shutterstock.com

In our new research, we therefore sought to reexamine the geography of cash provision, using Bristol as a case study. Through detailed mapping of the city’s cash infrastructure, we found stark differences in access to cash between different types of neighbourhood. Sites of economic activity, perhaps unsurprisingly, are well served; as were some of the most deprived, relatively central, neighbourhoods.

But we also found that areas we classify as “squeezed suburbs” – relatively deprived areas on the fringes of the city – were poorly catered for. This represents a significant challenge for some of the older and less well-off residents in these areas, who are most likely to depend on cash. We found Post Offices, which offer cash withdrawals and some banking services, are often geographically best-placed to serve these communities and could be a crucial asset moving forward, at least if used correctly.

Deprived areas worse off

There are signs that the situation is now changing again. Recent research revealed that around 1,700 ATMs nationwide changed from free to fee-charging at the start of 2019, likely the result of lower overall demand for cash and a recent drop in the interchange fees paid by banks when someone withdraws cash from another company’s ATM.

This was also noticeable in our research, as we gathered data both in October 2018 and March 2019. Importantly, we found that such changes were happening more often in deprived areas. Over two-thirds of the ATMs that became fee-charging in Bristol over this time period were within particularly deprived neighbourhoods.

This seems to be because ATM infrastructure in more deprived areas tends to be non-bank owned. Comparing a relatively affluent part of the city (Whiteladies Road in the Clifton neighbourhood) with a more deprived area (Stapleton Road in the Easton neighbourhood), we noticed that while just 29% of ATMs in Whiteladies Road are non-bank owned, this rises to 89% in Stapleton Road. Some such non-bank ATM owners have publicly stated that they will convert more free ATMs to fee-charging ATMs following the recent reduction in interchange fees.

This could have far-reaching implications for already under-served communities. So, while a future without cash may be almost inevitable, if the patterns found in Bristol are replicated nationally, it is likely that we’ll see a return to old geographies of financial exclusion, with deprived communities struggling most on the journey there.The Conversation

Daniel Tischer, Lecturer in Management, University of Bristol; Jamie Evans, Senior Research Associate, University of Bristol, and Sara Davies, Senior Research Fellow, University of Bristol

This article is republished from The Conversation under a Creative Commons license. Read the original article.


Read more about this research

Mapping the availability of cash (PDF)